Category: Support

  • How to Install and Secure OpenClaw (Moltbot) on a Cloud Server

    1. Overview

    This guide explains how to deploy and secure OpenClaw (Moltbot) on a Cloud Virtual Machine.

    By following this guide, you will:

    • Choose the appropriate Cloud plan.
    • Create a Virtual Machine.
    • Install OpenClaw.
    • Connect messaging channels.
    • Secure the installation for production use.

    2. System Requirements

    RequirementMinimumRecommended
    CPU1 vCPU2 vCPU
    Memory (RAM)1 GB4–8 GB
    Storage500 MB20–30 GB
    Operating SystemLinux (any)Ubuntu 22.04 or 24.04 LTS
    RuntimeNode.js 22+Node.js 22 LTS
    NetworkPublic IPv4Public IPv4 + Firewall

    3. Create the Virtual Machine

    1. Log in to the Cloud dashboard.
    2. Navigate to Compute → Create VM.
    3. Select the required plan.
    4. Choose Ubuntu 22.04 LTS or Ubuntu 24.04 LTS.
    5. Add an SSH key or configure a root password.
    6. Create the Virtual Machine.
    7. Note the public IP address after deployment.

    4. Install OpenClaw

    Step 1: Update the System

    Bash
    sudo apt update && sudo apt upgrade -y
    curl -fsSL https://deb.nodesource.com/setup_24.x | sudo -E bash – && sudo apt install -y nodejs

    Step 2: Configure Corepack

    Bash
    corepack enable
    corepack prepare pnpm@latest –activate
    pnpm setup
    source ~/.bashrc

    Step 3: Install npm

    Bash
    npm install -g npm@11.8.0
    Verify the installation:
    node –version
    npm –version

    Step 4: Install Docker

    Bash
    curl -fsSL https://get.docker.com | sudo sh
    sudo usermod -aG docker $USER

    Verify Docker:

    Bash
    docker –version

    Step 5: Install OpenClaw

    Bash
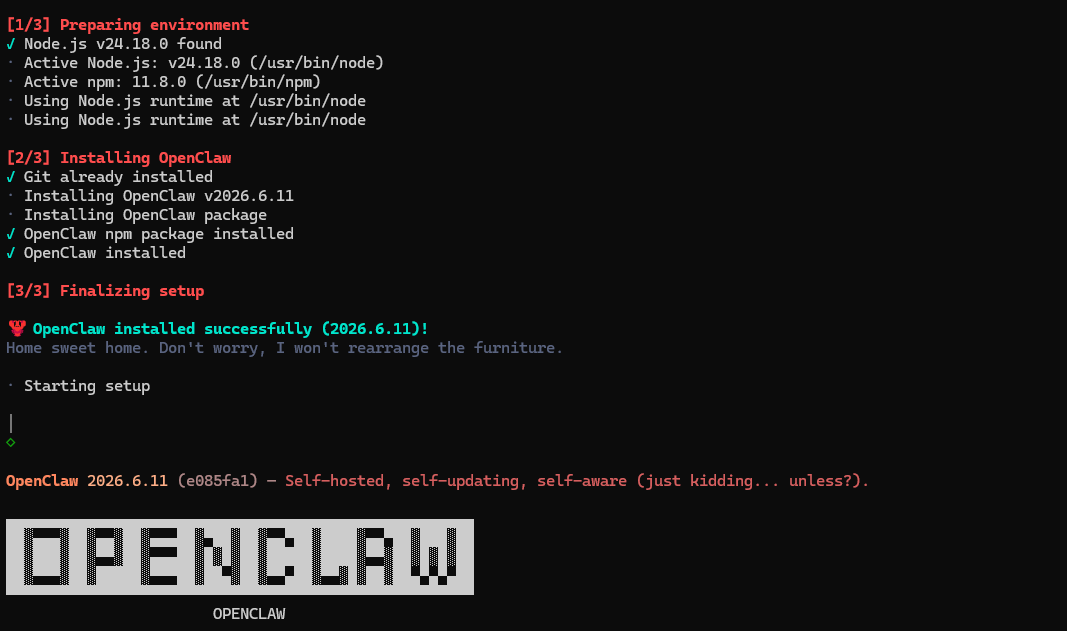
    curl -fsSL https://openclaw.ai/install.sh | bash

    Verify the installation:

    Bash
    openclaw –version

    Open claw

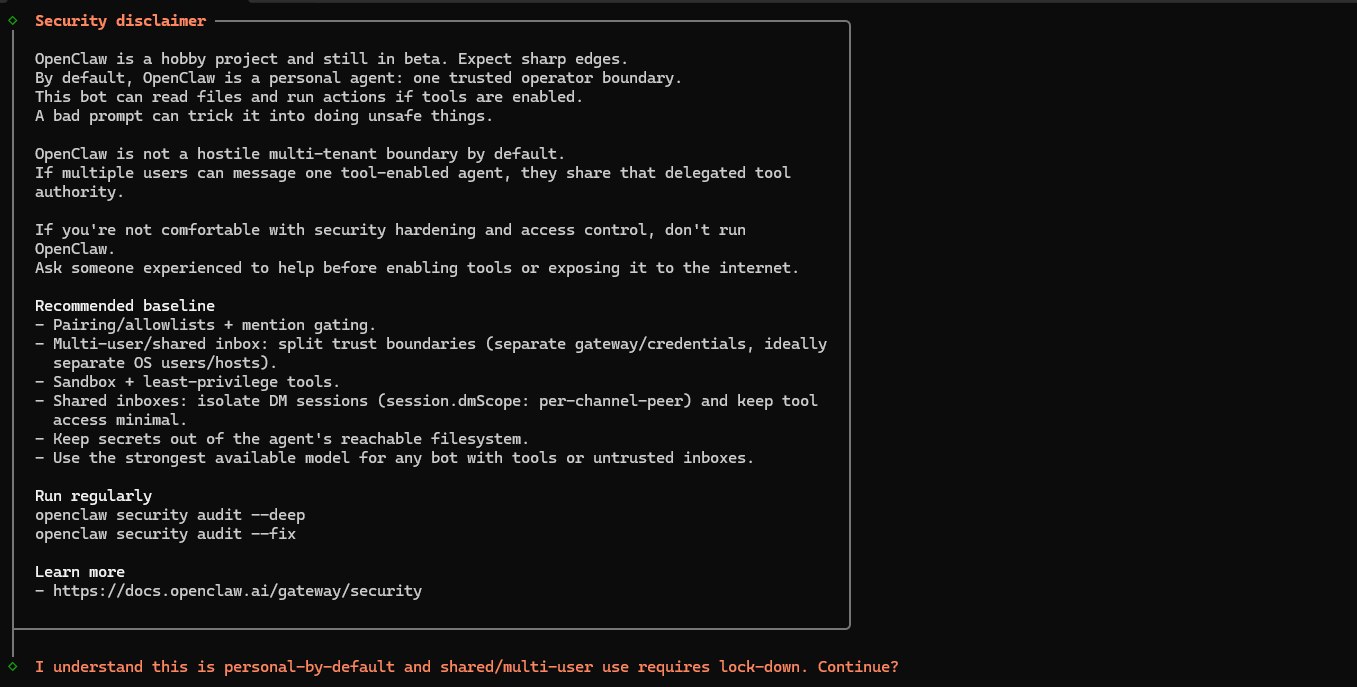
    Set up

    Step 6: Run the Initial Configuration

    openclaw onboard

    Follow the prompts to configure:

    • AI provider
    • API key
    • Basic settings

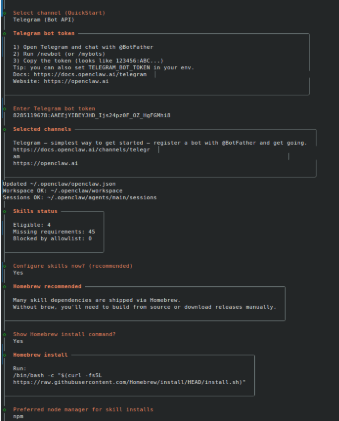
    Setup

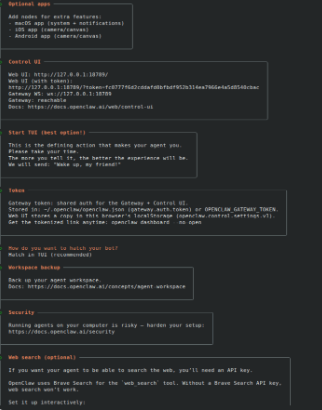
    Setup

    6. Connect Communication Channels

    Telegram

    1. Open Telegram.
    2. Search for @BotFather.
    3. Run /newbot.
    4. Copy the bot token.
    5. Paste the token when prompted by OpenClaw.

    WhatsApp

    Run:

    Bash
    openclaw channels login whatsapp

    A QR code is displayed.

    Open WhatsApp on your phone:

    Linked Devices → Link a Device

    Scan the QR code to complete the connection.

    Configure the allowed users:

    channels:
    whatsapp:
    allowFrom:
    – “+91XXXXXXXXXX”
    – “+91XXXXXXXXXX”

    Slack

    Create a Slack application.

    Enable Socket Mode.

    Configure the required Bot Token and App Token.

    Add the tokens to the configuration:

    channels:
    slack:
    botToken: “xoxb-your-bot-token-here”
    appToken: “xapp-your-app-token-here”

    Gmail

    Configure Gmail by:

    • Creating a Google Cloud project.
    • Enabling the Gmail API.
    • Enabling the Pub/Sub API.
    • Creating a Service Account.
    • Creating a Pub/Sub topic and subscription.
    • Adding the credentials path to the OpenClaw configuration.

    7. Secure the Installation

    Enable Docker Sandboxing

    Configure:

    agents:
    defaults:
    sandbox:
    mode: “non-main”

    Configure the Cloud Firewall

    Create firewall rules to:

    • Allow SSH only from trusted IP addresses.
    • Block the gateway port from public access.
    • Deny all other inbound traffic by default.

    Configure UFW

    Bash
    sudo ufw default deny incoming
    sudo ufw default allow outgoing
    sudo ufw allow ssh
    sudo ufw enable
    sudo ufw status

    Access the Dashboard

    Create an SSH tunnel:

    Bash
    ssh -L 18789:localhost:18789 moltbot-user@your-server-ip

    Open:
    http://localhost:18789/

    If a gateway token is required, run:

    Bash
    openclaw dashboard –no-open

    Use the generated URL to access the dashboard.

    Configure Allowed Users

    Example:

    channels:
    whatsapp:
    allowFrom:
    – “+91XXXXXXXXXX”

    slack:
    allowUsers:
    – “U01XXXXXXXX”

    Enable Automated Backups

    Open the Cloud dashboard.

    Navigate to:

    Virtual Machine → Backups

    Enable automated backups.

    Run the Health Check

    Bash
    moltbot doctor

    8. Run OpenClaw as a Service

    Create the systemd service:

    Bash
    sudo tee /etc/systemd/system/openclaw.service

    Reload systemd:

    Bash
    sudo systemctl daemon-reexec
    sudo systemctl daemon-reload

    Enable and start the service:

    Bash
    sudo systemctl enable openclaw
    sudo systemctl start openclaw

    Verify the service:

    Bash
    sudo systemctl status openclaw

    View the logs:

    Bash
    journalctl -u openclaw -f

    9. Troubleshooting

    WhatsApp QR Code Does Not Appear

    Verify that Node.js 22 or later is installed.

    Bash
    node –version

    Slack Bot Does Not Respond

    Verify that:

    • Socket Mode is enabled.
    • Bot Token and App Token are configured correctly.

    High Memory Usage

    If multiple communication channels are enabled with browser automation, consider upgrading the Virtual Machine to a larger plan.

    Health Check Shows Warnings

    Run:

    Bash
    moltbot doctor

    Review each warning and apply the recommended corrections.
  • Supported Guest Operating Systems

    1. Overview

    This article lists the guest operating system templates currently available on the Cloud platform.

    Some legacy operating system templates are available for compatibility or migration purposes. However, operating systems that have reached End of Life (EOL) are not recommended for new production deployments because they may no longer receive security updates or patches from the vendor.

    For production environments, it is recommended to use actively supported operating systems such as Ubuntu 22.04 LTS, Ubuntu 24.04 LTS, or Rocky Linux 9.

    2. Supported Linux Operating Systems

    DistributionVersionEnd of Life(EOL)
    Ubuntu24.04.x LTSApril 2036
    22.04.x LTSApril 2034
    20.04.x LTSApril 2032
    Rocky Linux10.xMay 2035
    9.xMay 2032
    8.xMay 2029
    AlmaLinux10.xMay 2035
    9.xMay 2032
    8.xMarch 2029
    Debian12.xJune 2028
    11.xAugust 2026
    CentOS7.xJune 2024

    Notes

    • CentOS 7.x reached End of Life (EOL) in June 2024. It may remain available for compatibility or migration purposes but is not recommended for new deployments.
    • Debian 11.x is approaching End of Life (EOL) in August 2026. For long-term production workloads, use Debian 12.x or another actively supported Linux distribution.

    3. Supported Windows Operating Systems

    DistributionEnd of Life(EOL)
    Windows Server 2025 (Available in both regions now)October 2034
    Windows Server 2022October 2031
    Windows Server 2019January 2024

    Notes

    • Windows Server 2019 reached End of Life (EOL) in January 2024. It no longer receives vendor security updates or patches. It may remain available for compatibility or migration purposes but is not recommended for new deployments.

    4. Important Considerations

    Architecture Support

    Cloud guest operating system templates are currently supported on AMD-based x86_64 virtual machine infrastructure.

    GPU Workloads

    GPU-enabled workloads are currently available only in the IN-WEST2 region.

    The NVIDIA driver installation guide for L4 GPU Virtual Machines currently supports the following operating systems:

    • Ubuntu 20.04 LTS
    • Ubuntu 22.04 LTS
    • Ubuntu 24.04 LTS

    GPU Driver Compatibility

    GPU driver installation and compatibility depend on the selected guest operating system version and workload requirements.

    Verify application and driver compatibility before deploying GPU workloads.

  • Virtual Machine Creation Error Troubleshooting

    1. Overview

    This guide explains how to identify and resolve common errors that may occur while creating a Virtual Machine (VM) on the Cloud platform.

    2. Common Virtual Machine Creation Errors

    2.1 No Available Public IPs

    Cause

    The selected region has no available public IP addresses.

    Resolution

    • Select a different region (for example, create the VM in West-3 instead of West-2).
    • If a public IP is not required, create the VM using only a private IP address.

    2.2 Insufficient Quota

    Cause

    The project has reached its allocated quota for resources such as CPU, RAM, storage volumes, or GPU.

    Resolution

    • Delete any unused Virtual Machines or storage volumes.
    • If additional resources are required, request a quota increase from Cloud Support.

    2.3 Network or Subnet Not Found

    Cause

    The selected network is incorrect, or the required network or subnet has been deleted.

    Resolution

    • Select the correct network and subnet during Virtual Machine creation.
    • If the required network or subnet does not exist, create a new private network and subnet.

    2.4 Volume Creation Failed

    Cause

    The storage backend encountered an error, or there is insufficient storage capacity.

    Resolution

    • Try creating the Virtual Machine again.
    • Verify that the storage quota has not been exceeded.
    • Create the volume manually and attach it to the Virtual Machine.

    3. When to Contact Support

    Contact Cloud Support if:

    • The same error occurs in multiple regions.
    • No public IP addresses are available in the selected region.
    • There are issues related to images or flavors.

    Provide the following information when contacting support:

    • Screenshot of the error message.
    • Region name.
    • Virtual Machine flavor.
    • Operating system image.
    • Time when the error occurred.
  • Understanding Snap and Its Installation on Linux

    1. Overview

    Snap is a universal package management system for Linux that packages applications together with all required dependencies. This allows software to run consistently across different Linux distributions.

    This guide explains what Snap is, its main features, how to install it on different Linux distributions, and how to use it.

    2. What Is Snap?

    Snap is a Linux packaging system that bundles applications with their required dependencies.

    This helps ensure that applications run reliably on different Linux distributions without requiring additional packages.

    3. Features of Snap

    Snap provides the following features:

    • Includes all required dependencies within the package.
    • Supports automatic background updates.
    • Works across multiple Linux distributions.
    • Uses security confinement (sandboxing) to help isolate applications.

    4. Why Use Snap?

    Snap simplifies software installation and management by providing:

    • Compatibility across multiple Linux distributions.
    • Automatic updates.
    • Application isolation through sandboxing.
    • Access to newer software versions than those available in traditional package repositories.

    Examples:

    Install Visual Studio Code:

    Bash
    sudo snap install code –classic

    Install Spotify:

    Bash
    sudo snap install spotify

    Install Docker:

    Bash
    sudo snap install docker

    5. Snap Components

    Snap consists of the following components:

    • Snap Packages – Self-contained applications that include their dependencies.
    • snapd – The background service that manages Snap packages.
    • Channels – Release channels such as stable, candidate, beta, and edge, allowing you to choose between stable releases and newer features.

    6. Install Snap

    Ubuntu

    Snap is usually installed by default.

    Verify the installation:

    Bash
    snap version

    If Snap is not installed:

    Bash
    sudo apt update
    sudo apt install snapd

    Debian

    Bash
    sudo apt update
    sudo apt install snapd
    sudo systemctl enable –now snapd.socket

    Fedora

    Bash
    sudo dnf install snapd
    sudo ln -s /var/lib/snapd/snap /snap

    CentOS / RHEL

    Bash
    sudo yum install epel-release
    sudo yum install snapd
    sudo systemctl enable –now snapd.socket
    sudo ln -s /var/lib/snapd/snap /snap

    Arch Linux

    Bash
    sudo pacman -S snapd
    sudo systemctl enable –now snapd.socket
    sudo ln -s /var/lib/snapd/snap /snap

    7. Common Snap Commands

    Search for a Package

    Bash
    snap find <package-name>

    Install a Package

    Bash
    sudo snap install <package-name>

    Remove a Package

    Bash
    sudo snap remove <package-name>

    List Installed Packages

    Bash
    snap list

    Update Installed Packages

    Bash
    sudo snap refresh

    Example

    Bash
    Install VLC:
    sudo snap install vlc

    Display installed Snap packages:

    Bash
    snap list

    8. Troubleshooting

    Snap Service Is Not Running

    Start and enable the Snap service:

    Bash
    sudo systemctl enable –now snapd.socket

    Snap Command Not Found

    Verify that snapd is installed and that the system PATH is configured correctly.

    Permission Issues

    If required, run Snap commands with sudo.

    9. Conclusion

    Snap provides a simple way to install and manage software on Linux by packaging applications together with their dependencies.

    It supports multiple Linux distributions, provides automatic updates, and helps avoid dependency conflicts while keeping software up to date.

  • Troubleshooting Load Balancer Health Check Failures

    1. Overview

    This guide explains how to identify and resolve health check failures when using a Cloud Load Balancer.

    2. Operating System Checks

    2.1 Verify That the Application or Service Is Running

    Linux

    Check the service status:

    Bash
    systemctl status <service-name>

    Restart the service if required:

    Bash
    systemctl restart <service-name>

    Verify that the application is listening on the required port:

    Bash
    ss -tulnp | grep <port>

    Windows

    Open Services (services.msc) and verify that the required service is running.

    Check the listening port:

    Command Prompt
    netstat -ano | findstr <port>

    Find the process using the PID:

    Command Prompt
    tasklist /FI “PID eq <pid>”

    2.2 Test the Health Check Endpoint Locally

    Linux

    Bash
    curl -I http://localhost:<port>/<health-path>

    or

    Bash
    curl http://127.0.0.1:<port>/<health-path>

    Windows (PowerShell)

    PowerShell
    Invoke-WebRequest -Uri http://localhost:<port>/<health-path> -UseBasicParsing

    Note: For HTTP or HTTPS health checks, the endpoint should return an HTTP status code between 200 and 299.

    2.3 Check the Operating System Firewall

    Linux

    For systems using firewalld:

    Bash
    sudo firewall-cmd –list-all

    For Ubuntu using UFW:

    Bash
    sudo ufw status

    For systems using iptables:

    Bash
    sudo iptables -L -n

    Windows

    Command Prompt
    Get-NetFirewallRule | Where-Object { $_.Direction -eq ‘Inbound’ -and $_.Enabled -eq ‘True’ } | Format-Table DisplayName,Profile,Action

    2.4 Verify That the Application Is Listening on the Private Interface

    If the application is listening only on 127.0.0.1, the Load Balancer cannot reach it.

    The application should listen on 0.0.0.0 or the VM’s private IP address.

    Linux

    Bash
    ss -tulnp | grep <port>

    or

    Bash
    netstat -tulnp | grep <port>

    2.5 Test Connectivity from Another Internal Virtual Machine

    Test the backend service from another VM on the same network.

    Bash
    curl http://<backend-private-IP>:<port>/<health-path>

    or

    Bash
    telnet <backend-private-IP> <port>

    or

    Bash
    nc -vz <backend-private-IP> <port>

    Note: If direct connectivity fails, resolve the backend application, firewall, or operating system issue before troubleshooting the Load Balancer.

    2.6 Check Application Logs

    Linux

    View the service logs:

    Bash
    journalctl -u <service-name> -n 200

    View system logs:

    Bash
    tail -n 200 /var/log/messages

    View web server logs:

    Bash
    tail -n 200 /var/log/nginx/error.log

    or

    Bash
    tail -n 200 /var/log/httpd/error_log

    Windows

    • Open Event Viewer and review the Application and System logs.
    • For IIS, review the logs located at:
    C:\inetpub\logs\LogFiles

    2.7 Check System Resources

    Linux

    Bash
    top
    free -m
    df -h

    Windows

    Use Task Manager to check:

    • CPU usage
    • Memory usage
    • Disk usage

    3. Load Balancer Checks

    3.1 Verify the Health Check Configuration

    Confirm that the health check settings match the backend application.

    Verify the following:

    • Protocol: TCP, HTTP, or HTTPS
    • Port: Matches the backend service port
    • Health Check Path (HTTP/HTTPS): Returns an HTTP status code between 200 and 299

    Recommended settings:

    SettingRecommended Value

    Interval10 seconds
    Timeout5 seconds
    Healthy Threshold3
    Unhealthy Threshold3

    3.2 Verify Backend Pool Configuration

    Confirm the following:

    • The correct backend Virtual Machine is added to the backend pool.
    • The correct private IP address is selected, especially if the VM has multiple network interfaces.
    • The backend service port is configured correctly.

    3.3 Verify Firewall and Security Rules

    Ensure that the backend firewall or security rules allow inbound traffic from the Load Balancer’s private IP range on the configured health check port.

    If the Load Balancer cannot reach the backend because of firewall restrictions, the health checks will fail.

  • Resolving the “No Bootable Device” Error During Windows 11 Installation from an ISO

    1. Overview

    This guide explains how to resolve the “No Bootable Device” error that may occur when installing Windows 11 from an uploaded ISO file.

    The issue is caused by missing virtual TPM (vTPM) support, which is required for Windows 11 installation.

    2. Issue

    When creating a new Virtual Machine (VM) and installing Windows 11 using an uploaded ISO, the VM may fail to boot and display the following message:

    Booting from Hard Disk…
    Boot failed: not a bootable disk
    No bootable device.

    3. Cause

    This issue occurs because the Virtual Machine is not configured with vTPM (Virtual Trusted Platform Module).

    Windows 11 requires hardware features such as:

    • TPM 2.0
    • Secure Boot support

    If vTPM is not enabled, the installation may fail or the ISO may not be recognized as a bootable device.

    4. Solution

    Follow these steps to create and deploy the Windows 11 Virtual Machine.

    Step 1: Select the Region

    Log in to the Cloud dashboard and select the region where you want to deploy the Virtual Machine.

    Step 2: Open the Advance Panel

    Navigate to:
    Advance Panel → Create Virtual Machine

    Step 3: Configure the Virtual Machine

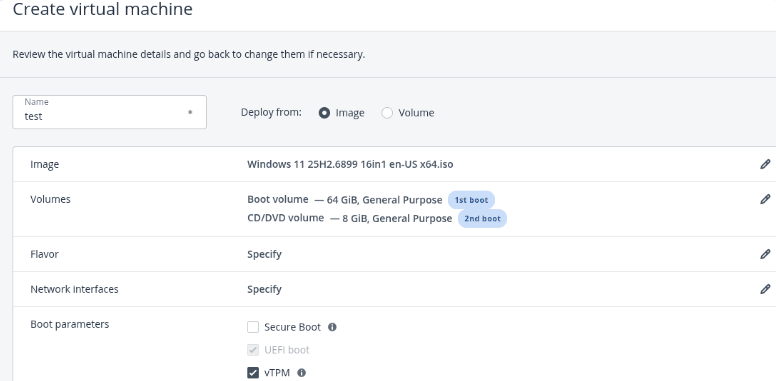
    Configure the following settings:

    • Deploy From: Image
    • Image: Select the uploaded Windows 11 ISO
    • Volumes:
      • Boot Volume
      • CD/DVD Volume
    • Flavor: Select the required CPU and RAM configuration.
    • Network Interfaces: Assign the required network.

    Step 4: Configure the Boot Settings

    Enable the following options:

    • UEFI Boot (automatically selected)
    • vTPM (Virtual Trusted Platform Module)

    Secure Boot is optional and may remain disabled if it is not required.

    Step 5: Deploy the Virtual Machine

    Click Deploy.

    The Virtual Machine will boot from the Windows 11 installation media and display the Windows setup screen.

    Deploy

    5. What Is vTPM?

    vTPM (Virtual Trusted Platform Module) is a virtual implementation of the TPM 2.0 hardware module.

    It provides cryptographic security functions for Virtual Machines and allows Windows 11 to detect the required TPM functionality during installation.

    6. Why vTPM Must Be Enabled

    Windows 11 requires TPM 2.0 for installation and secure operation.

    If vTPM is not enabled:

    • The Virtual Machine may not recognize the Windows ISO as a bootable device.
    • The installation may fail with errors such as:
      • No bootable device
      • This PC can’t run Windows 11
  • Network Troubleshooting Using MTR

    1. Overview

    MTR (My Traceroute) is a network diagnostic tool that combines the functionality of ping and traceroute.

    Unlike ping or traceroute, which provide a single snapshot of the network, MTR continuously monitors the network path and displays real-time information about latency and packet loss.

    This guide explains what MTR is, how it works, how to interpret the results, and how to use it on different operating systems.

    2. What Is MTR?

    MTR (My Traceroute) is a network troubleshooting tool that:

    • Combines the features of ping and traceroute.
    • Displays real-time latency and packet loss statistics.
    • Continuously monitors the route between your system and the destination host.

    MTR is commonly used by system administrators, network engineers, and support teams to identify network connectivity issues.

    3. Why Use MTR?

    MTR helps you:

    • Identify where packet loss occurs.
    • Detect network latency at different hops.
    • Determine whether the issue is:
      • Within the local network.
      • With the Internet Service Provider (ISP).
      • Within a transit provider’s network.
      • At the destination server.
    • Collect information for troubleshooting and support cases.

    4. How MTR Works

    MTR combines two network tools:

    • Traceroute, which identifies the path packets take to the destination.
    • Ping, which continuously sends packets to each hop and measures latency and packet loss.

    Unlike traceroute, MTR continuously updates the results, allowing you to monitor network conditions in real time.

    5. Understanding MTR Output

    Running the following command:

    Bash
    mtr <hostname>

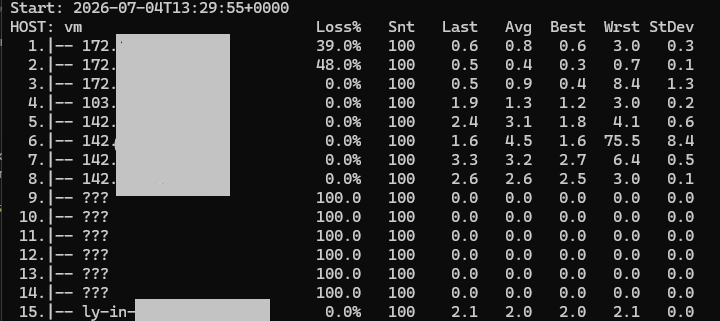
    produces output similar to:

    MTR

    ColumnDescription
    HostThe router or network hop.
    Loss%

    Percentage of packets lost at the hop.
    SntNumber of packets sent.

    LastLatest round-trip time (milliseconds).

    AvgAverage latency.

    BestLowest latency recorded.

    WrstHighest latency recorded.

    StDevVariation in latency.

    Interpreting the Results

    • High packet loss at the first hop usually indicates a local network issue.
    • Packet loss beginning at one hop and continuing through later hops may indicate an issue with the network provider.
    • Packet loss shown on one intermediate hop, while later hops show no loss, usually indicates ICMP rate limiting and is generally not a network problem.
    • Latency that increases and remains high across subsequent hops may indicate network congestion.

    6. Using MTR

    Linux

    Install MTR

    Ubuntu / Debian

    Bash
    sudo apt update
    sudo apt install mtr

    CentOS / RHEL

    Bash
    sudo yum install mtr

    Run MTR

    Bash
    mtr google.com

    Generate a report using 100 packets:

    Bash
    mtr -r -c 100 google.com

    macOS

    Install MTR using Homebrew:

    Bash
    brew install mtr

    Run MTR:

    Bash
    sudo mtr google.com

    Windows

    Use WinMTR, the graphical version of MTR.

    1. Download WinMTR.
    2. Run WinMTR.exe.
    3. Enter the destination hostname (for example, google.com).
    4. Start the test.

    7. Common Use Cases

    MTR can be used for:

    • Troubleshooting slow website connections.
    • Identifying packet loss caused by an ISP.
    • Monitoring connectivity between data centers.
    • Collecting network information for support cases.

    8. Best Practices

    • Use at least 100 packets (-c 100) for more accurate results.
    • Test the connection in both directions whenever possible.
    • Do not assume packet loss on an intermediate hop is a problem unless it continues to later hops.
    • Use MTR together with other network tools such as ping, iperf, and netstat for a complete analysis.

    9. Conclusion

    MTR is a real-time network diagnostic tool that combines the features of ping and traceroute.
    By continuously monitoring latency and packet loss, MTR helps identify network issues more accurately and provides useful information for troubleshooting and escalation.

  • Managing Cloud Using API (West 2 Region)

    1. Overview

    This guide explains how to authenticate with the Cloud API in the West 2 region using an Application Credential ID and Secret Key.

    After successful authentication, you will receive an authentication token that can be used for subsequent API requests.

    2. Required Credentials

    Before you begin, ensure you have the following credentials provided by the administrator:

    • Application Credential ID (Sample: f963abac76886493#########)
    • Project ID (Sample: 831f026XXXXXXXXX83de1ce1e923)
    • Application Credential Secret (Sample: my_super_secret_pass)

    Note: You can refer to the appropriate article to generate these credentials.

    3. Prerequisites

    Ensure the following tools are installed on your system:

    • curl
    • jq

    4. Install Required Tools

    Install curl

    CentOS / RHEL / AlmaLinux / Rocky Linux

    Bash
    sudo yum install curl -y

    Ubuntu / Debian

    Bash
    sudo apt update
    sudo apt install curl -y

    Install jq

    Ubuntu / Debian

    Bash
    sudo apt update
    sudo apt install -y jq

    CentOS / RHEL / AlmaLinux

    Bash
    sudo yum install -y jq

    Verify the Installation

    Verify that both utilities are installed successfully.

    Bash
    jq –version
    curl –version

    5. Verify API Availability

    Before authenticating, confirm that the API endpoint is reachable.
    Run:

    Bash
    curl -kv https://in-west2.controlcloud.app:5000/

    If the API is available, the command returns the response headers indicating that the Keystone authentication service is reachable.

    6. Authenticate with the API

    Send a POST request to obtain an authentication token.

    
    curl -ksD – -o /dev/null \
    -H “Content-Type: application/json” \
    -d ‘{
    “auth”: {
    “identity”: {
    “methods”: [
    “application_credential”
    ],
    “application_credential”: {
    “id”: “d638abac76884533#########”,
    “secret”: “my_super_secret_pass”
    }
    }
    }
    }’ https://in-west2.controlcloud.app:5000/v3/auth/tokens
    

    Replace the sample ID and Secret with the credentials provided to you.

    7. Expected Response

    If authentication is successful, the API returns:

    • HTTP 201 Created
    • An authentication token in the response headers.

    If authentication fails, the API returns:

    • HTTP 401 Unauthorized

    8. Troubleshooting

    Authentication Failed (401 Unauthorized)

    If you receive a 401 Unauthorized response, verify the following:

    • Confirm that the Application Credential ID and Secret are correct.
    • Verify that you are using the correct authentication URL.
    • Check that the API endpoint is reachable by running:
    Bash
    curl -kv https://in-west2.controlcloud.app:5000/
    • Ensure that the credentials have permission to access the API.

    9. View Authenticated Session Details

    To retrieve information about the authenticated session, run:

    Bash
    curl -X GET “https://in-west2.controlcloud.app:5000/v3/auth/tokens” \
    -H “X-Auth-Token: <AUTH_TOKEN>” \
    -H “X-Subject-Token: <AUTH_TOKEN>” \
    -H “Content-Type: application/json” | jq

    Replace <AUTH_TOKEN> with the authentication token returned during the authentication request.

    Response Details

    The command returns information such as:

    • Authenticated user details.
    • Assigned roles.
    • Accessible projects.
    • Available service endpoints.

    10. Conclusion

    After successful authentication, an authentication token is returned.

    Use this token in the X-Auth-Token header when making additional API requests, and store it securely for future use.

  • Installing OpenStack Command Line Client

    1. Overview

    This guide explains how to install and configure the OpenStack Command Line Client (CLI) on a Linux system. After installation and configuration, you can use the CLI to manage OpenStack resources from the command line.

    2. Prerequisites

    Before you begin, ensure that:

    • You have access to an OpenStack environment.
    • You have administrative (root or sudo) privileges.
    • Python 3.x is installed on the system.
    • The system has an active internet connection to download the required packages.

    3. Installation Overview

    The OpenStack CLI can be installed on a Linux system using pip (Python package manager).

    Before installing the client, install the required Python dependencies. After installation, configure the CLI using an OpenStack RC file to authenticate with your OpenStack environment.

    4. Install the OpenStack CLI

    Step 1: Install Required Dependencies

    Ubuntu / Debian

    Bash
    sudo apt update
    sudo apt install python3-pip python3-dev python3-venv

    CentOS / RHEL

    Bash
    sudo yum install python3-pip python3-devel

    Step 2: Install the OpenStack Client

    Install the OpenStack CLI using pip:

    Bash
    pip install python-openstackclient

    Note: It is recommended to install the OpenStack client inside a Python virtual environment to avoid conflicts with other Python packages.

    Step 3: Verify the Installation

    After the installation is complete, verify that the OpenStack CLI is installed successfully:

    Bash
    openstack –version

    The command displays the installed version of the OpenStack client.

    5. Configure the OpenStack CLI

    Step 1: Download the OpenStack RC File

    Download the OpenStack RC file from the OpenStack Dashboard.

    Navigate to:

    Project → API Access → Download OpenStack RC File

    The RC file contains the authentication details required to access your OpenStack project.

    Step 2: Source the RC File

    Run the following command to load the authentication environment variables:

    Bash
    source /path/to/openstack_rc_file.sh

    Example RC file:
    export OS_AUTH_TYPE=v3applicationcredential
    export OS_AUTH_URL=”https://in-west3.controlcloud.app:5000/v3″

    # Application credential
    export OS_APPLICATION_CREDENTIAL_ID=””
    export OS_APPLICATION_CREDENTIAL_SECRET=””

    # Optional
    export OS_REGION_NAME=”RegionOne”

    Update the Application Credential ID and Application Credential Secret with your own values before using the file.

    Step 3: Verify the Configuration

    Run the following command:

    Bash
    openstack token issue

    If the configuration is correct, the command returns an authentication token, confirming that the CLI can communicate with the OpenStack environment.

    6. Common OpenStack CLI Commands

    List Servers

    Bash
    openstack server list

    Create a Server

    Bash
    openstack server create –image <image_id> –flavor <flavor_id> –network <network_id> <server_name>

    List Networks

    Bash
    openstack network list

    Create a Network

    Bash
    openstack network create <network_name>

    Create a Volume

    Bash
    openstack volume create –size 10 <volume_name>

    7. Troubleshooting

    Authentication Failed

    If you receive an Authentication failed error:

    • Verify that the OpenStack RC file has been sourced correctly.
    • Confirm that the authentication credentials are correct.

    Command Not Found

    If the openstack command is not available:

    • Verify that the OpenStack client was installed successfully.
    • Reinstall the package using pip if necessary.

    8. Conclusion

    After installing the OpenStack CLI and configuring it with the appropriate RC file, you can manage your OpenStack resources directly from the command line.

    Always ensure that you source the correct RC file before running OpenStack commands.
    For additional information, refer to the official OpenStack documentation.

  • How to Whitelist an IP Address in ConfigServer Firewall (CSF)

    1. Overview

    This guide explains how to whitelist an IP address using ConfigServer Security & Firewall (CSF) in WHM.

    2. Whitelist an IP Address

    Step 1: Log In to WHM

    Log in to WHM using the root account.

    Step 2: Open ConfigServer Security & Firewall

    Navigate to:
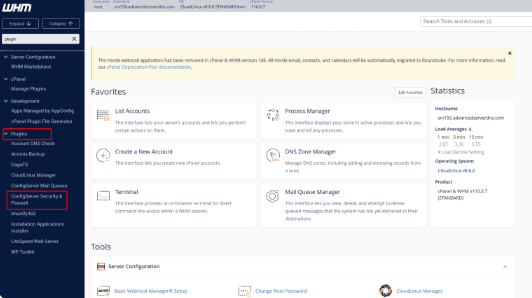
    WHM → Plugins → ConfigServer Security & Firewall
    WHM

    Step 3: Add the IP Address

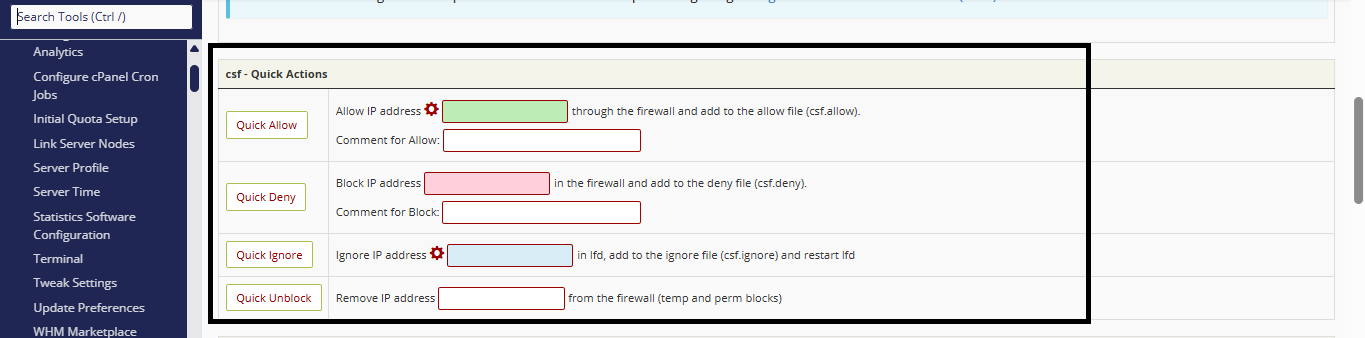
    1. Locate the text box next to the Quick Allow button.
    2. Enter the IP address that you want to whitelist.
    3. Click Quick Allow.

    Plugins

    3. Additional Options

    Quick Deny

    The Quick Deny option can be used to block an IP address from accessing the server.

    Quick Ignore

    The Quick Ignore option also allows an IP address, similar to Quick Allow, but with different behavior.

    • Quick Allow: The IP address is whitelisted. However, it can still be blocked later if it triggers ModSecurity rules or exceeds the allowed number of failed login attempts.
    • Quick Ignore: The IP address is excluded from blocking. It will not be blocked by ModSecurity or LFD (Login Failure Daemon), even if it triggers security rules or repeated login failures.