1. Overview
MTR (My Traceroute) is a network diagnostic tool that combines the functionality of ping and traceroute.
Unlike ping or traceroute, which provide a single snapshot of the network, MTR continuously monitors the network path and displays real-time information about latency and packet loss.
This guide explains what MTR is, how it works, how to interpret the results, and how to use it on different operating systems.
2. What Is MTR?
MTR (My Traceroute) is a network troubleshooting tool that:
- Combines the features of ping and traceroute.
- Displays real-time latency and packet loss statistics.
- Continuously monitors the route between your system and the destination host.
MTR is commonly used by system administrators, network engineers, and support teams to identify network connectivity issues.
3. Why Use MTR?
MTR helps you:
- Identify where packet loss occurs.
- Detect network latency at different hops.
- Determine whether the issue is:
- Within the local network.
- With the Internet Service Provider (ISP).
- Within a transit provider’s network.
- At the destination server.
- Collect information for troubleshooting and support cases.
4. How MTR Works
MTR combines two network tools:
- Traceroute, which identifies the path packets take to the destination.
- Ping, which continuously sends packets to each hop and measures latency and packet loss.
Unlike traceroute, MTR continuously updates the results, allowing you to monitor network conditions in real time.
5. Understanding MTR Output
Running the following command:
mtr <hostname>produces output similar to:
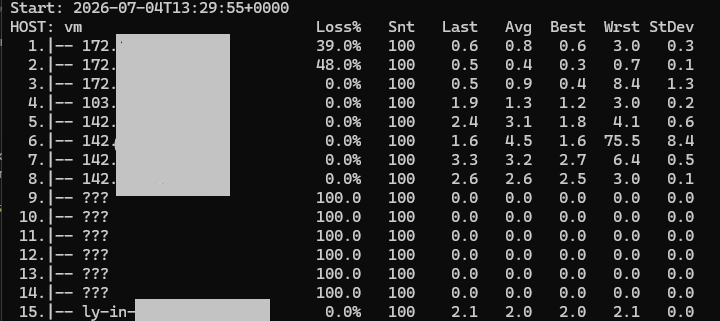
| Column | Description |
|---|---|
| Host | The router or network hop. |
| Loss% | Percentage of packets lost at the hop. |
| Snt | Number of packets sent. |
| Last | Latest round-trip time (milliseconds). |
| Avg | Average latency. |
| Best | Lowest latency recorded. |
| Wrst | Highest latency recorded. |
| StDev | Variation in latency. |
Interpreting the Results
- High packet loss at the first hop usually indicates a local network issue.
- Packet loss beginning at one hop and continuing through later hops may indicate an issue with the network provider.
- Packet loss shown on one intermediate hop, while later hops show no loss, usually indicates ICMP rate limiting and is generally not a network problem.
- Latency that increases and remains high across subsequent hops may indicate network congestion.
6. Using MTR
Linux
Install MTR
Ubuntu / Debian
sudo apt update
sudo apt install mtr
CentOS / RHEL
sudo yum install mtrRun MTR
mtr google.comGenerate a report using 100 packets:
mtr -r -c 100 google.commacOS
Install MTR using Homebrew:
brew install mtrRun MTR:
sudo mtr google.comWindows
Use WinMTR, the graphical version of MTR.
- Download WinMTR.
- Run WinMTR.exe.
- Enter the destination hostname (for example, google.com).
- Start the test.
7. Common Use Cases
MTR can be used for:
- Troubleshooting slow website connections.
- Identifying packet loss caused by an ISP.
- Monitoring connectivity between data centers.
- Collecting network information for support cases.
8. Best Practices
- Use at least 100 packets (-c 100) for more accurate results.
- Test the connection in both directions whenever possible.
- Do not assume packet loss on an intermediate hop is a problem unless it continues to later hops.
- Use MTR together with other network tools such as ping, iperf, and netstat for a complete analysis.
9. Conclusion
MTR is a real-time network diagnostic tool that combines the features of ping and traceroute.
By continuously monitoring latency and packet loss, MTR helps identify network issues more accurately and provides useful information for troubleshooting and escalation.